High-Water Mark Analysis
The high-water mark is equal to the maximum cumulative return over a given period. The high-water mark can be calculated using daily or month-end data.
There are two ways to see high-water mark data in the application. There is a high-water mark add-on, that can be placed on any screen in the application. As shown at the bottom-left of the screenshot below, the add-on displays the maximum cumulative return, the date that return was achieved, and the return since.
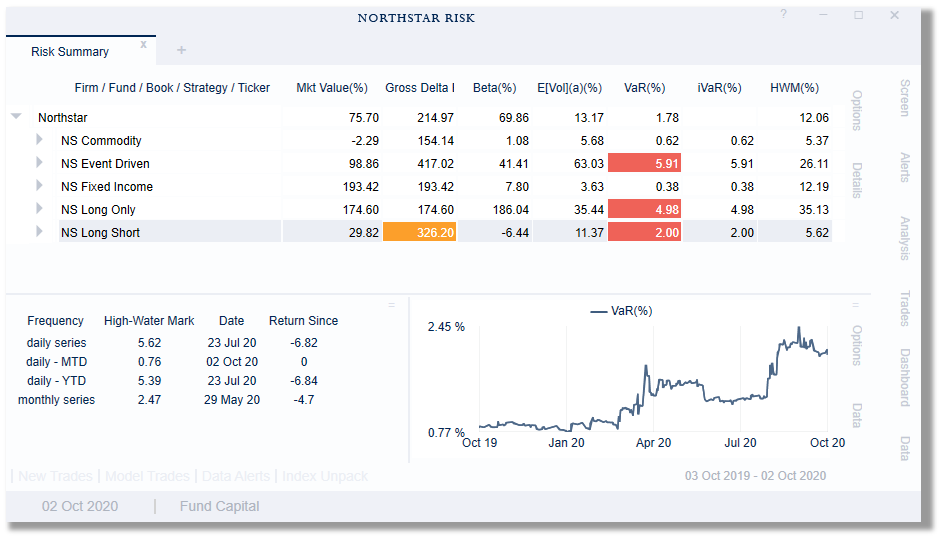
You can also add high-water mark fields to the main grid. In the screen-shot, the rightmost column, HWM(%) is the high-water mark for the selected date range.
Unless you choose MTD or YTD, the high-water mark will be based on the screen’s date range (set and displayed at the bottom-right of the application).