2020 US Presidential Election Stress Tests
Rather than relying on expert opinion, we have adopted a strictly data-based approach to designing our election stress test scenarios. We know that many of you will want to combine our stress tests with your own analysis. To make this as easy as possible, we decided not only to describe the mechanics of our stress test, but how we developed the scenarios.
Early on, we considered two approaches
The first was to analyze the run-up to the 2020 election, itself. We hoped that we would be able to see correlation between changing poll numbers and the returns of various risk factors. Unfortunately, the poll numbers have been extremely stable, and the market has been overwhelmed by COVID-19. Any signal that we may have hoped to see, has been buried in an avalanche of noise.
The second approach we considered, was to look at past elections. The benefit of this approach was that it provided a much larger data set (if somewhat less specific).
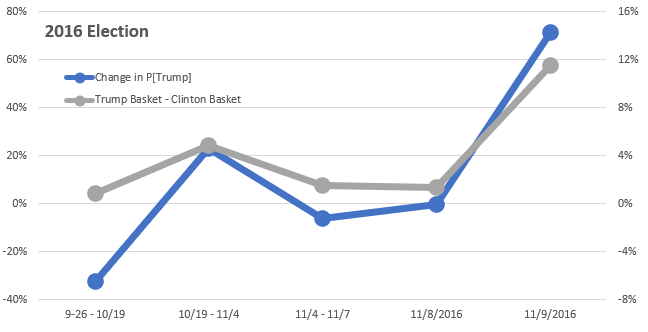
In the end, we decided to focus on the 2016 election. In terms of candidates, it was the next best thing to 2020, and in 2016 the poll numbers changed dramatically, against a relatively calm market backdrop.
Surprise matters
Most importantly, the result of the 2016 election was a significant surprise. This is important not only for our analysis, but for understanding our results. What happens to the markets immediately after the election is not just about who wins, it is about how that outcome differs from expectations. The expected outcome should be reflected in the market on the eve of the election. In other words, if Biden is strongly favored to win, and Biden does win, we do not expect markets to move much. On the other hand, if the polls are 50/50 the night before the election or Trump is favored to win, and Biden wins, then we would expect the market to move a lot.
Factors
In developing our scenarios, we looked at 45 different risk factors. We created a number of new factors along the way, including an Aerospace & Defense factor, a Metals & Mining factor and a Gun Manufactures factor.
We thought gun manufacturers would be interesting to look at, but we realized that there were very few pure-play gun manufacturers left. Most have diversified into sporting goods or outdoor equipment. To get a pure factor, we had to compare gun manufacturers not to the broad market, but to other sporting goods manufactures and retailers. To do this, we created a custom SPORTS index, which includes Nike, Under Armour, Adidas, Dick’s Sporting Goods, and Brunswick Corporation. We then regressed our gun manufacturers (Smith & Wesson, Strum Ruger, Vista Outdoor) against this.
Of the 45 factors, we selected 10 factors to define our scenario. We picked the factors that were most correlated with the poll numbers in 2016, while avoiding factors that were highly correlated with each other. Some factors that we expected to be important (e.g. Aerospace & Defense) did not make the cut, while other that may not have seemed likely beforehand (e.g. VIX) were included.
Some factors even entered with the opposite sign of what we expected. For example, we expect a Trump win to be negative for gun manufacturers. However, in the run-up to the 2016 election, some gun owners rushed to buys guns and ammunition ahead of an expected Clinton win, but, when Trump won, that demand disappeared and stock prices of gun manufacturers dropped.
The final 10 factors we selected form an index. The data set is very small, but when we compared changes in the level of our factor index to changes in poll numbers from FiveThirtyEight, the changes were 96% correlated.
Importantly, we think it is important to focus on the probability of winning, which is not the same as the expected vote share. A candidate that is expected to get 55% of the vote, might have a 90% chance of winning.
The Stress Scenarios
Our final stress scenarios were based on the returns the day after the election, November 9th, 2016.

So, for example, on November 9th, 2016, our Metals & Mining factor was up 6.06% and our Mexico factor had a return of −9.98%. The Biden Surprise Win scenario is just the opposite of the Trump Surprise Win.
How to Adjust & Other Factors to Consider
On November 8th, 2016, the probability of Clinton winning was 71.4%. Looked at another way, from the 8th to the 9th, the probability of Trump winning went from 28.6% to 100%, a +71.4% change in probability.
So, the Trump Win scenario in the application is based on a +71.4% change in probability of Trump winning. Similarly, our Biden Win scenario is based on a +71.4% change in the probability of Biden winning.
What if the probabilities are different this time? What if, on the eve of the election, the probability of Trump winning is 50%. We suggest adjusting the stress test results proportionally. If you believe the probability of Trump winning is 40%, then a Trump win this time would represent a change in probability of +60%, not +71.4%. Because the surprise is not as great, the returns should be less extreme. For example, if the Trump Surprise Win stress test in the application predicts a loss of 8% for your portfolio, then you should expect a loss of −6.72% in 2020 if Trump wins,
[2020 return if Trump wins] = [Trump Stress Test] x [2020 Prob. Change] / [2016 Prob. Change]
[2020 return if Trump wins] = −8% x 60% / 71.4% % = −6.72%
[2020 return if Trump wins] = −6.72%
Obviously, Biden is not Clinton, and a lot has changed since 2016. We do not have any data to support these types of modifications, but this should not stop you from making your own adjustments.
Also, it is easy to focus on the Presidential election, which gets the lion’s share of media attention, but there is ample evidence that the markets react to changes in House and Senate control, as well. It almost certainly makes sense to make adjustments for that as well.
Both elections and markets are notoriously difficult to forecast. Predicting the impact of elections on markets is bound to be complicated. Which brings us to our very important disclaimer,
Disclaimer
The results presented in this analysis are based on historical data and includes various assumptions. Past performance is no guarantee of future results. Under no circumstances should this analysis be construed as offering investment advice.